1. How do I search for information in HealthStats NSW?
There are three ways of searching for data in HealthStats NSW:
- Keyword search: The search box at the top of the home page provides a list of search results for any keyword. Type in your search term and click the search icon which will take you to a results page. Results include suggestions for topics related to your search term.
- Topic Explorer: The Topics tab on the home page takes you to an A-Z list of topics. Each selected topic provides a link to all indicators available on that topic.
- Location Explorer: The Locations tab on the home page takes you to an A-Z list of Local Health Districts, Local Government Areas or Primary Health Networks. Each selected location provides a link to all topics available for that location.
2. Can I analyse data in HealthStats NSW?
HealthStats NSW is a tool for exploring changes in data based on demographic and geographic characteristics in an interactive way. It flexibly allows users to compare data for categories within a group (such as trends in smoking categories for males) or between groups (such as comparing trends in daily smoking between males and females). Further analyses can be done by downloading the relevant data as a spreadsheet using your own software.
3. Can I use HealthStats NSW as a performance monitoring tool?
While data included in HealthStats NSW can be used for preparing performance reports on aspects of the NSW health system, the application does not provide data against performance targets which are set for the NSW health system. Performance monitoring data for hospitals and other parts of the NSW health system can be found in the Annual Report of the NSW Ministry of Health, the NSW Open Data website or from the Ministry of Health website.
For other performance monitoring data, see the Bureau of Health Information or My Hospitals websites.
4. How do I interpret the graphs in HealthStats NSW?
Age-specific rates and numbers of events
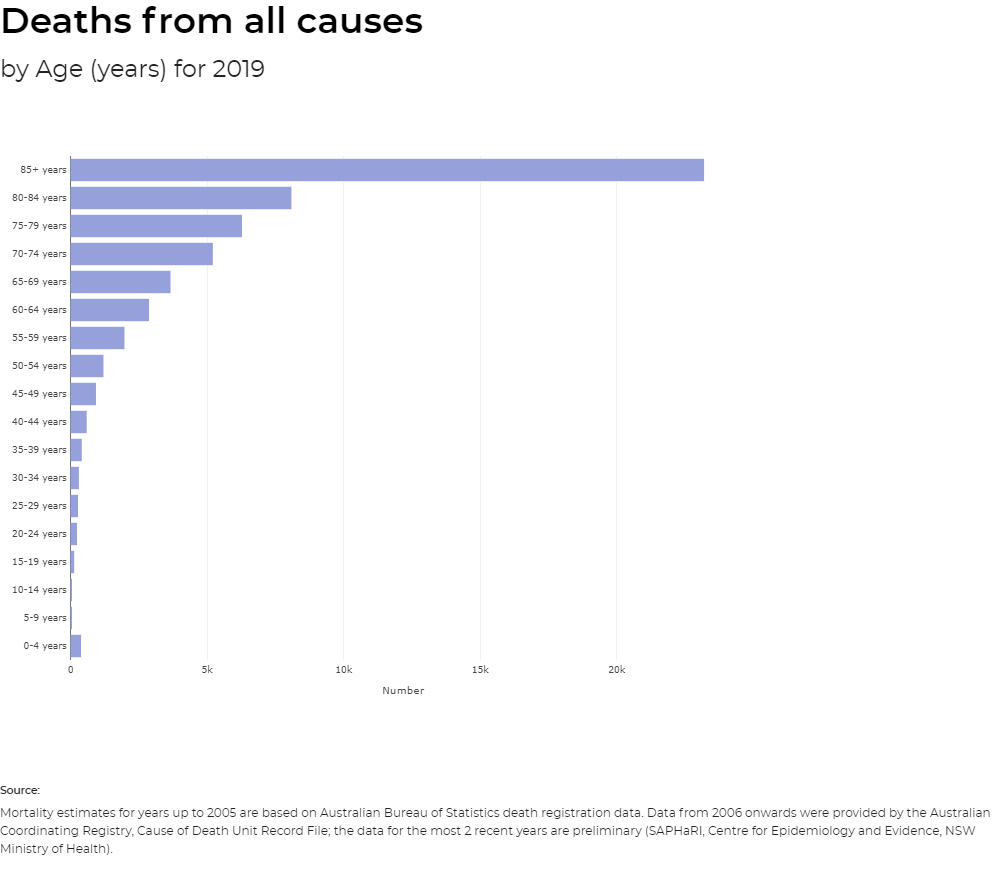
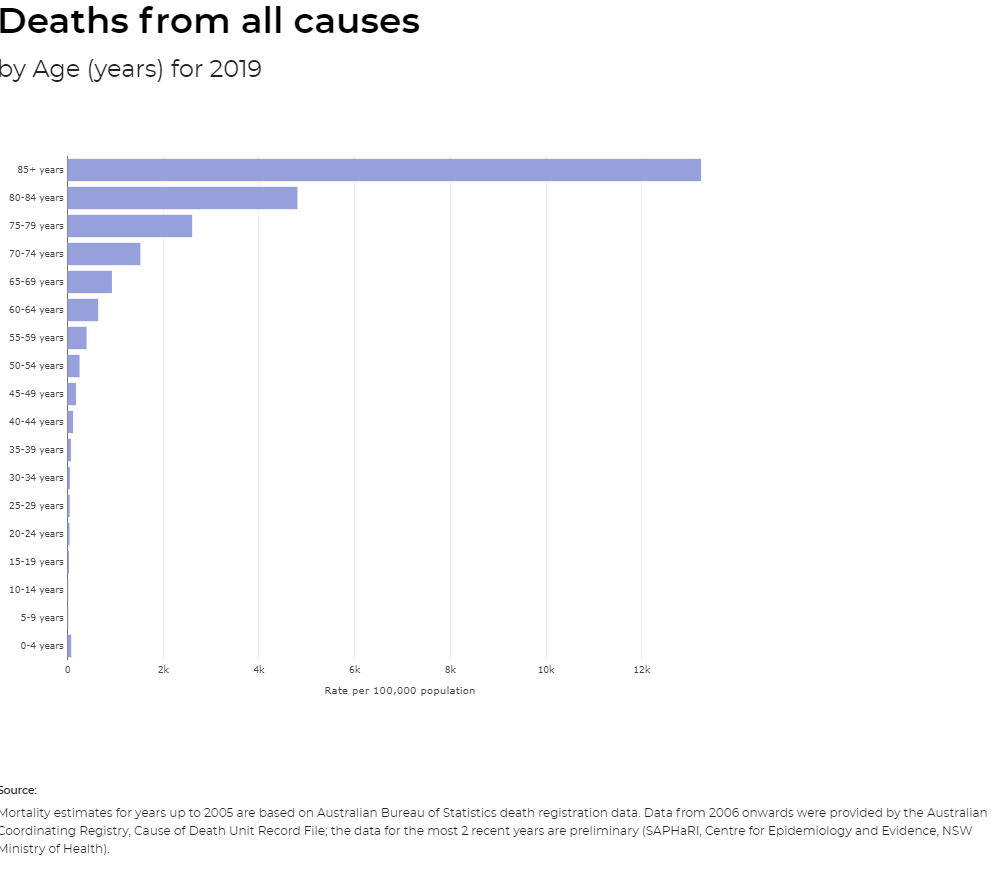
The figures below show total death rates and numbers of deaths in NSW for 2019 by age group (i.e. age-specific rates from all causes of death during this period). From these figures it is apparent that total death rates and numbers tend to increase with age, with the exception of infants and young children. These figures does not provide an indication of the causes of death.

Point estimates and 95% confidence intervals
Confidence intervals on HealthStats NSW are provided at the 95% level of significance; this is the same as the standard margin of error used in opinion polls. Roughly speaking, it can be interpreted to say that there is a 95% probability that the true population value lies within the interval provided. The more data we have the more certain we can be about our indicator value; this means that for smaller sample sizes there will be larger confidence intervals.
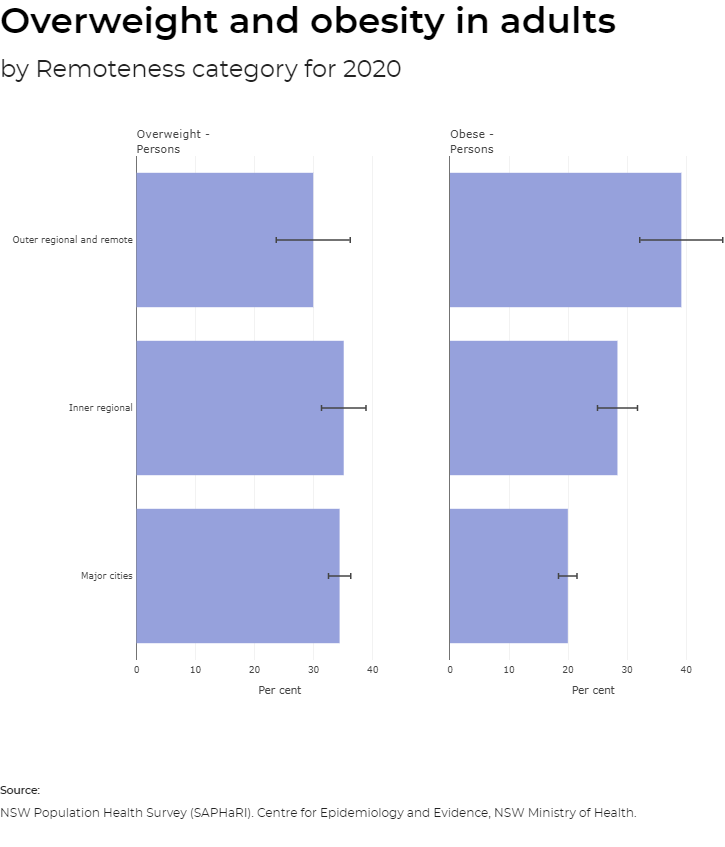
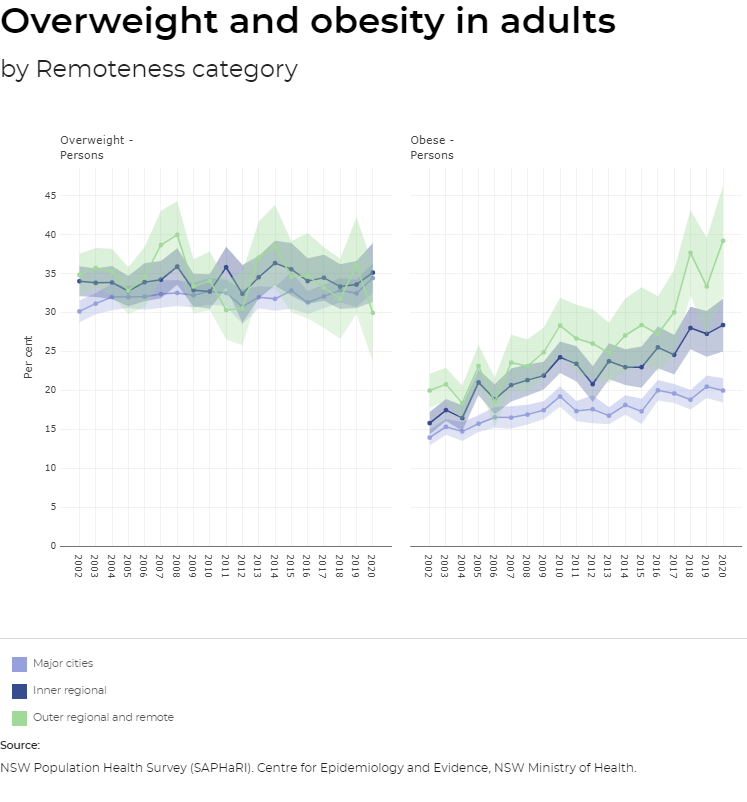
The figures below demonstrates the method used for graphical presentation of point estimates and associated 95% confidence intervals. It illustrates the varying widths of confidence intervals for remoteness categories within the Overweight and Obesity in Adults indicator. Given that there are smaller populations and smaller sample sizes with increasingly remote areas, the confidence intervals increase with increasing remoteness reflecting the increasing degree of uncertainty around the prevalence estimate. The lack of overlap of confidence intervals for the Obese category also shows a significant gradient in the difference between obesity prevalence in Major cities compared with Inner regional compared with Outer regional and Remote areas.
For further information on confidence intervals and their use in HealthStats NSW, see the Confidence intervals statistical update in HealthStats PLUS.


5. How do I print data tables from HealthStats NSW?
To print data tables from HealthStats NSW, you first need to download the data table in spreadsheet format (i.e. you can’t print directly from the data table obtained by clicking on the ‘Data table’ icon from the indicator page).
6. Will HealthStats NSW work with my web browser?
HealthStats NSW was designed for Google Chrome (latest), Firefox (latest), Safari, Microsoft Edge (two most recent versions) and iOS (latest) web browsers.
7. Is there additional assistance to learn how to use HealthStats NSW?
There are videos being developed to guide users on how to get the most out of HealthStats. These video clips are available here. Check in regularly for new content.
